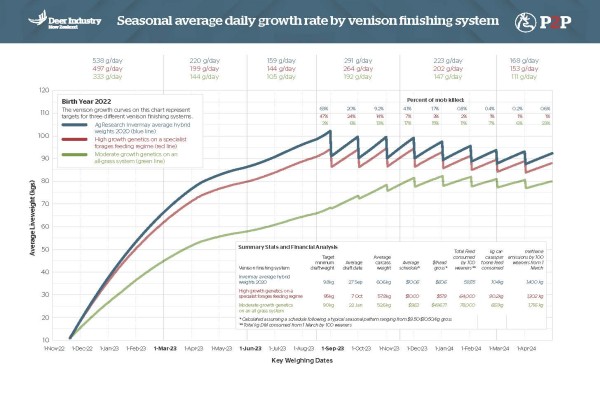
Many deer farmers find it helpful to set targets for the growth rate of their finishing animals and replacement hinds. Monitoring growth rates against these targets lets them know if they are on track, or if a change is needed in the management of the animals. The Deer Growth Curves provide predictions of growth to hit liveweight targets for young deer. Printed posters are available as well as on-line calculators.
Venison growth curve calculator
Using actual data from a large number of real farms the average growth curves for 'Spring Kill', and 'Summer Kill' venison animals are plotted month by month. These curves can be used to set targets for a desired kill profile, then monitor mob weights against the targets.
To download a printable copy of the latest Venison Growth Curve Poster, click here>>
To link to the Venison Growth Calculator, click here>>

Within the planner there are three curves representing three different venison finishing systems, all are targeting a spring chilled season kill: The red line represents a high growth genetics specialist forage feeding regime; the blue line is based on a high growth genetics on grass-plus system and the green line represents a moderate growth genetics system on all grass. Once drafting for slaughter starts, the curves take on a zig-zag shape. This is the consequence of removing the heaviest animals from the mob at each drafting, while still-growing animals remain in the mob between drafts.
The online calculator will predict kill weights and calculate gross income from venison sales based on a 1 September average mob weight. You can adjust drafting weights and anticipated venison schedule to allow comparison of different finishing options.
The calculator displays:
- Average draft date
- Calculated average gross income
- Average schedule
- Percentage of mob drafted before April 30
This resource has been produced as part of the Passion2Profit programme, a Primary Growth Partnership co-funded by Deer Industry New Zealand and the Ministry for Primary Industries.

