Deer Select can produce Genetic Trend graphs every time an analysis is undertaken to produce BVs and Indexes. These graphs are very useful for breeders and stock purchasers, as they show the genetic progress that a breeder is making over time.
Trend graphs
The trend graph shows the average merit of all animals born each year for the trait. They also indicate the size of rate of progress you could expect to make using their stock. You can ask your breeder to show you their trend graphs for the traits or indexes that are important to you.
The line can go up and down for different years, but the important thing is to view the overall trends for the BVs or Indexes for your breeding goal. Don’t be distracted by trends for BVs outside your breeding goal, or by minor ups and downs in the graph. Question why there may have been a dip or jump one year, but overall look for the trend over time; for your goal it should be moving in an upward direction, and the steeper the line the more rapid the improvement.
Example: Genetic Trend graph for Wapiti Terminal Index (Growth + Meat)
The four black lines show the average merit by birth year for 4 different studs compared to the average trend line in yellow of all herds. All are making progress, with one stud having achieved a much higher rate of gain than the other three.
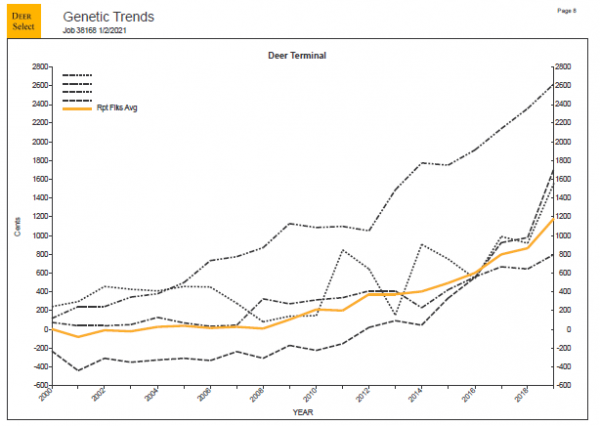
For most traits higher indexes or breeding values indicate higher merit for the trait, so a trend graph rising on the right axis showing a gain in merit for the trait is desirable
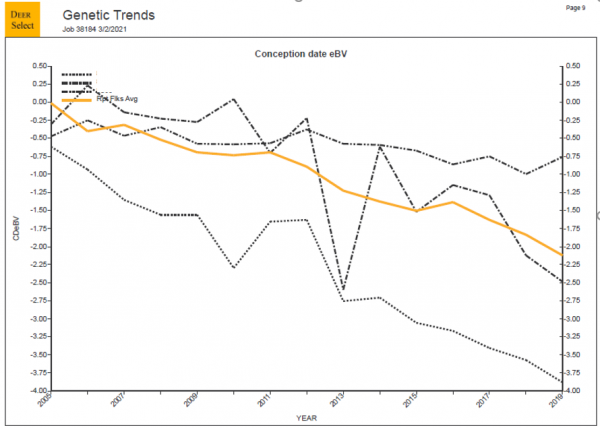
The exception is Conception Date (CDBV)
For conception date a more negative number indicates days earlier than average conceiving. The graph below shows the trend line for conception date for three Red deer studs. Two are showing a negative or earlier conception date (the downward line) and (the flatter line) shows only a minor change. It may be for the stud with the flatter line that this is not a trait they are selecting for.
It is important to match your breeding goals with a stud that is recording and selecting for the traits of interest to you.
Example: Genetic trend graph for Conception Date breeding value (CD BV)
Within each stud there will be a range of animals with a range of merit. Choose new sires with the “right size merit” for the traits of interest for your needs.